We need to talk about Zambia -The short case for Zambia 2027
May 20, 2016 Leave a comment
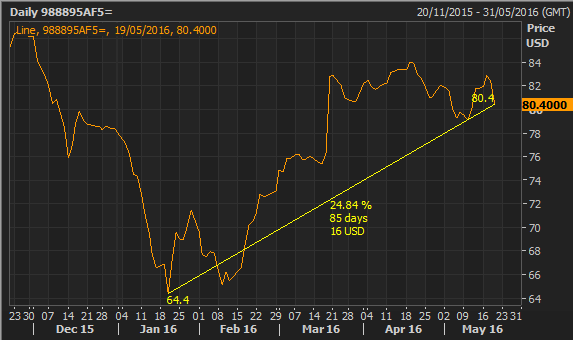
I’ve always thought that it never makes sense to get bullish unless you can see that the drivers of the bear market are breaking down. Hence the recent rally in Zambia USD paper has caught my attention. Especially the 2027USD bond.
This year we’ve seen the bond rally over 20% from trading at low 60’s to 80.
A rally across the curve has caused a downward shift.

It looks like what the market is forgetting about Zambia is copper. After reaching peak copper production in 2013, thanks to tax increases and power cuts, Zambia has struggled to hit production targets, so much so that it is seeing a flat line in copper production.

The chart shows the spread in yield between USD bonds issued by Zambia (average of 2022,2024 and 2027) and the US treasuries and the copper price. What’s important to me is that copper is trading around a 6 year low and it trades together with Zambia USD spreads.

The trading pattern of the curve has also been interesting to me. As you can see below, the rally ended in April, especially for the 2022 and 2024 paper, but not for the 2027. There seems to be lag, a bearish hump has now formed across the curve.

Tightening in the spread between the 2022 and 2027 this year.


The 2027 paper is now more expensive and trading higher than the 2024. Relatively the most expensive it’s been since issued in August last year.

In February this year, the country announced that the IMF were on the ground, the market reaction was very positive. But the fundamental facts still hold in my view-the bearish drivers Zambia struggled with have not changed, lower copper prices and slowing copper production, however for some reason the market is yet to price this in the 2027 paper. In my view the bond is now looking very attractive to short.


